Posts > Jay's Everyday > Projects > Attempts and Successes of a Home Dashboard

Attempts and Successes of a Home Dashboard

Originally, I remember thinking that home dashboards were a bit pointless and were really just there to be pretty graphs and something to leave on a screen 24/7 with no real reason to it. Then I started adding items to my home network… and then I added more… and then more… and then I started using DDNS services, web hosting, DNS, and a multitude of other systems

Too much

I first started, probably on the more difficult end, attempting to set up Grafana and Prometheus. Grafana would act as my dashboard and Prometheus as my data scraper for the graphs and different network items. At that point in time, I didn’t have an insane amount of objects on my network but I did want an easy (remember that word) way to check on my system utilization statistics and other items like how many ads my PiHole blocked that day. What I ended up finding out, is Grafana is an insanely in-depth and very customizable system, I have no doubts if I wanted to sit down and really churn the time to bend Grafana to my will that I could figure out everything and make a great dashboard. I attempted running both Grafana and Prometheus as their own VMs on my network. Instead, I got caught up on how to format the data and create a proper dashboard; lost in all of the details and configurations, I gave up.

An example of a Grafana dashboard -credits belong to /u/Tehlo

Too little…

This brought me to Heimdall. A muuuuuch more approachable dashboard and was very easy to set up. I personally installed it within a Docker container and had zero issues spinning up a docker-compose.yml and running the container. Once I made it in though, I saw that things were just a bit… too simple. The system is very straight forward and clean, I was able to set up the dashboard with the applications I wanted but I was lacking the ability of widgets and graphs. I had this set up for about a week but found that I wasn’t using it too much as it really just served the same purpose as my bookmarks bar of my web browser.

Example of a Heimdall Dash – credits belong to /u/anachronisdev

Juuuuust right.

My third attempt into the world of dashboards brought me to Dashy. I found the recommendation on a reddit post where someone was complaining about Grafana being too complicated (I wasn’t OP, I swear.) I love the integrations for different systems and working with Glancesas a data scraper was much easier than my previous attempts with Prometheus. The widgets on this system are easy to set up and it features things like health checks which I appreciate as it allows me to check different services to ensure that they are still up and running at a glance. The conf.yml is easy to figure out and the only real issues that I ran into included my own mistakes with formatting. The only thing I wish Dashy had was widget support inside the web editor. If you want to add widgets and system monitors, you’ll need to set those up inside of the conf.yml file (using a container, this is located at /app/public/conf.yml).

Example of one of my widget configurations

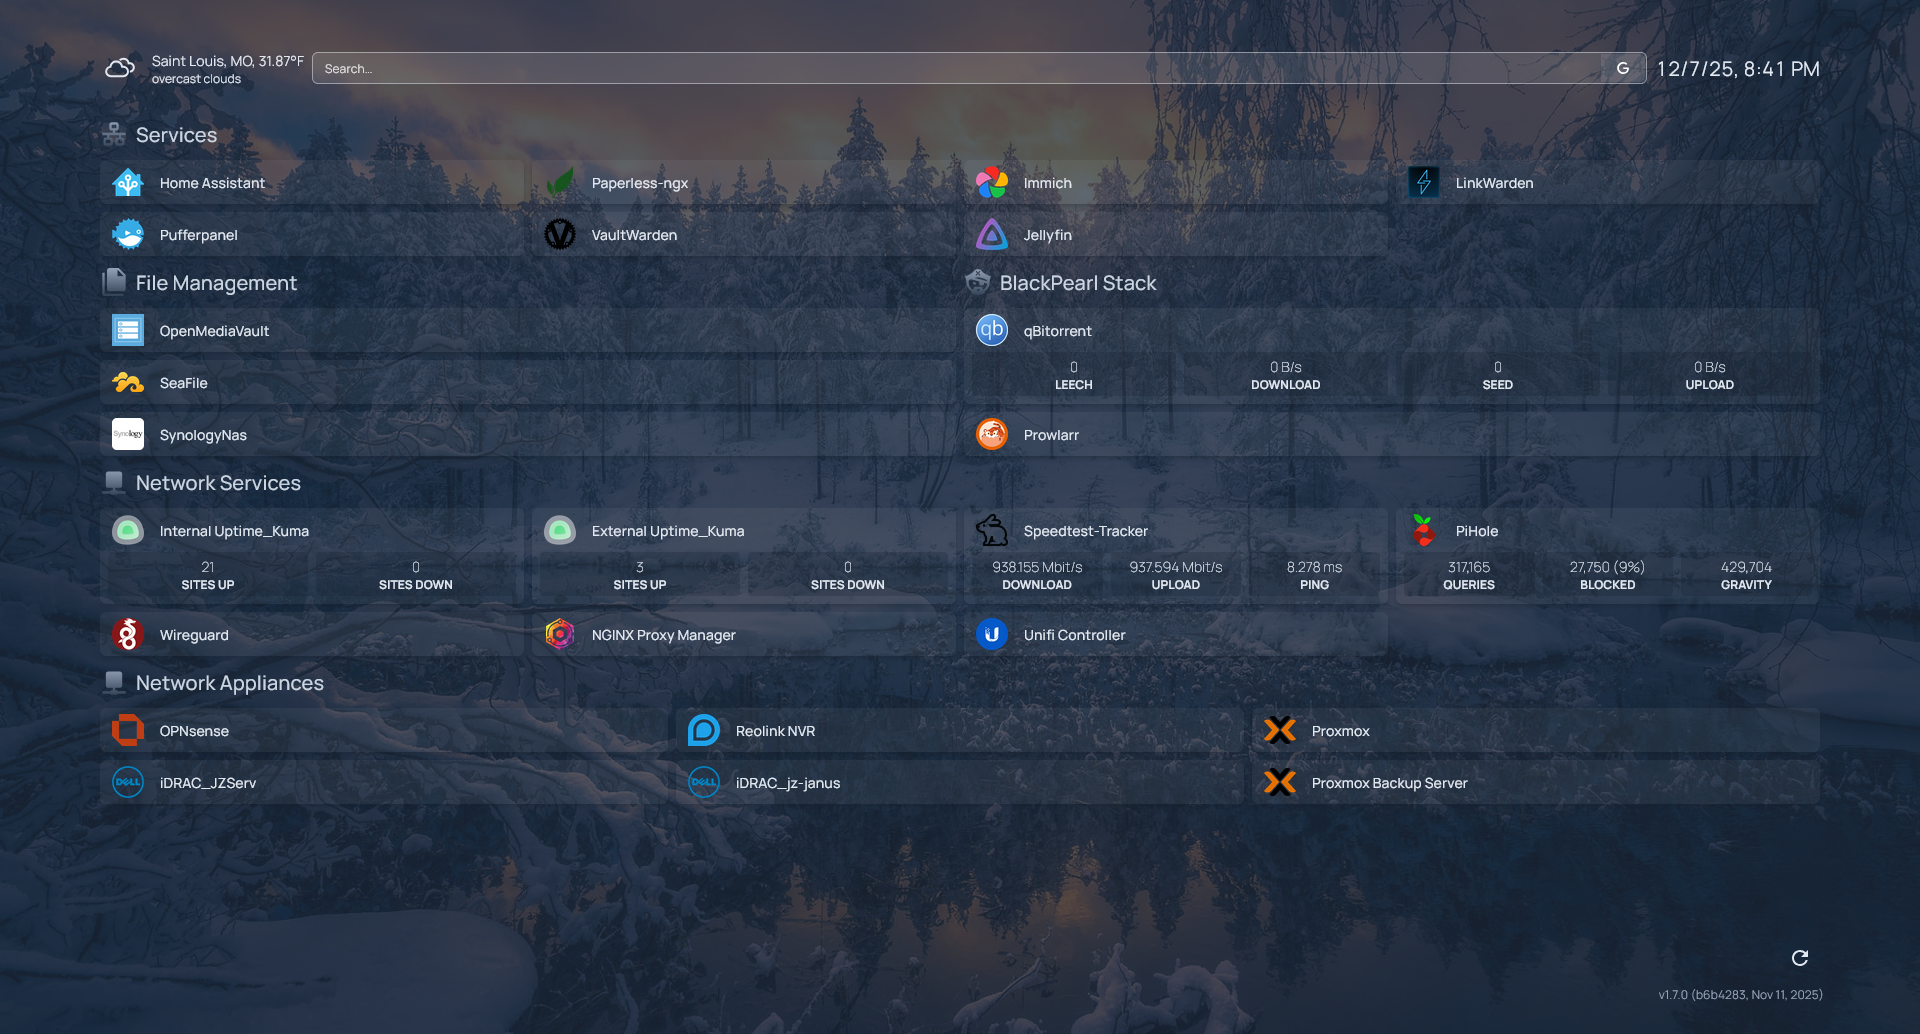
I think for the time being, Dashy has won my heart. It’s simple and easy enough to set up and make adjustments and I don’t really have the energy to uproot it all and start over anyway, Grafana will remain a challenge for another day for now.

My current dashboard setup. Links to my common used network resources and sites and an easy way to check in on my equipment.

Related Posts